7 Data Visualisation Tools & Dashboarding Apps Some Free Options
Have you read last weeks blog on What is Data Visualisation and Dashboarding? This tells you what data visualisation and dashboarding is and how it can save you time in your business.
This post may contain affiliate links which means I receive a small commission at no cost to you when you make a purchase
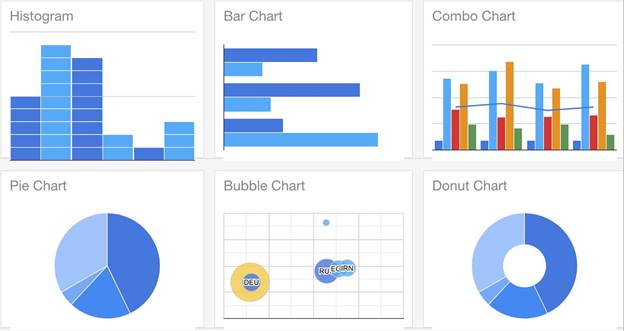
To start our list of data visualisation tools I thought we would start off with a free one. Google Charts is an easy to use data visualisation tool with a rating of 96% of people recommending this app on getapp.co.nz.
As it is a google product it easily connects to their other products like google sheets and forms. As it is a free product it doesn’t have all the same features and isn’t as customisable as a paid app and it has a watermark showing the software logo. Also as with all other google products you need to be online to use the app.
Features
- Compatability – works on any browser
- Multitouch Support – can use on touch screen devices including iPad and android based smart phones
- Free to use
- Dynamic – allows for chart modifications after charts have been generated
- Simple – is easy to learn and use
- Multiple axes – not restricted to just x & y axis. You can have multiple axis on the charts.
- Text rotation – supports label rotation in any direction.
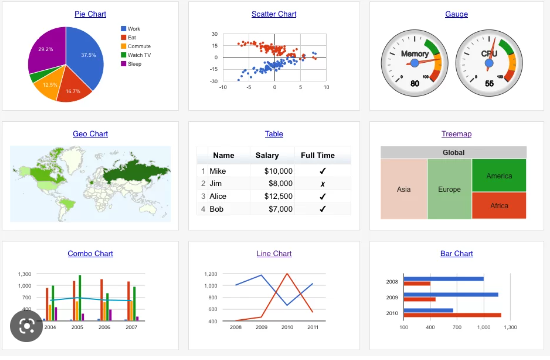
Key features of Google Charts include – content managemnet, custom dashboards, dataset management and visual discovery. The app includes a large list of ready to use chart types which can be customised to meet your requirements.
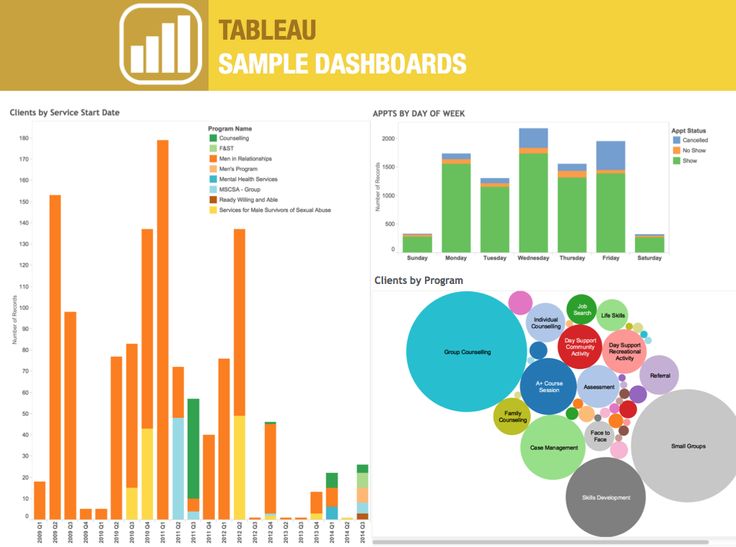
Tableau is currently the #1 ranked data visulaisation tool and the #2 ranked solution in top reporting tools. It is an option that is popular with large businesses like Amazon.com, Coca-Cola Company, Ferrari etc and is commonly compared with Microsoft BI. The software allows users to report insights using easy to use visualisations and dashboards that are customisable. The software makes it easy to organise, manage and visualise data. Tableau also integrates with hundreds of data sources including cloud and desktop applications.
Features
- Multiple data sources – Many data sources can be used including, spreadsheets, relational databases, non-relational databases, data warehouses and much more.
- Dashboard – This provides a complete view of your data through text, visulaisations and more.
- Sharing & collaboration – you can collaborate with other users in rea-time and share data instantly through visualisations, sheets and dashboards.
- Advanced charts & visualisations – there is a wode range of viaulaisations to choose from with the software.
- Maps – there is lots of pre-installed information on maps, including cities and postal ocdes etc.
- Security – the software has a foolproof security system and also gives you the option to integrate extra security protocols.
Benefits
- Data Visualisation
- Easy to create interactive visualisations quickly
- Easy to implement
- Has the ability to handle large amounts of data
- Uses varying scripting lanuguages
- Responsive dashboard and mobile support
Tableau has pricing structures for individuals and for teams with the cheapest option starting from $15 USD per month and the highest being $70 USD per month depending on the access you need for the software. Most would need the $70 USD per month subscription to have access to all the features to create dashboards etc.
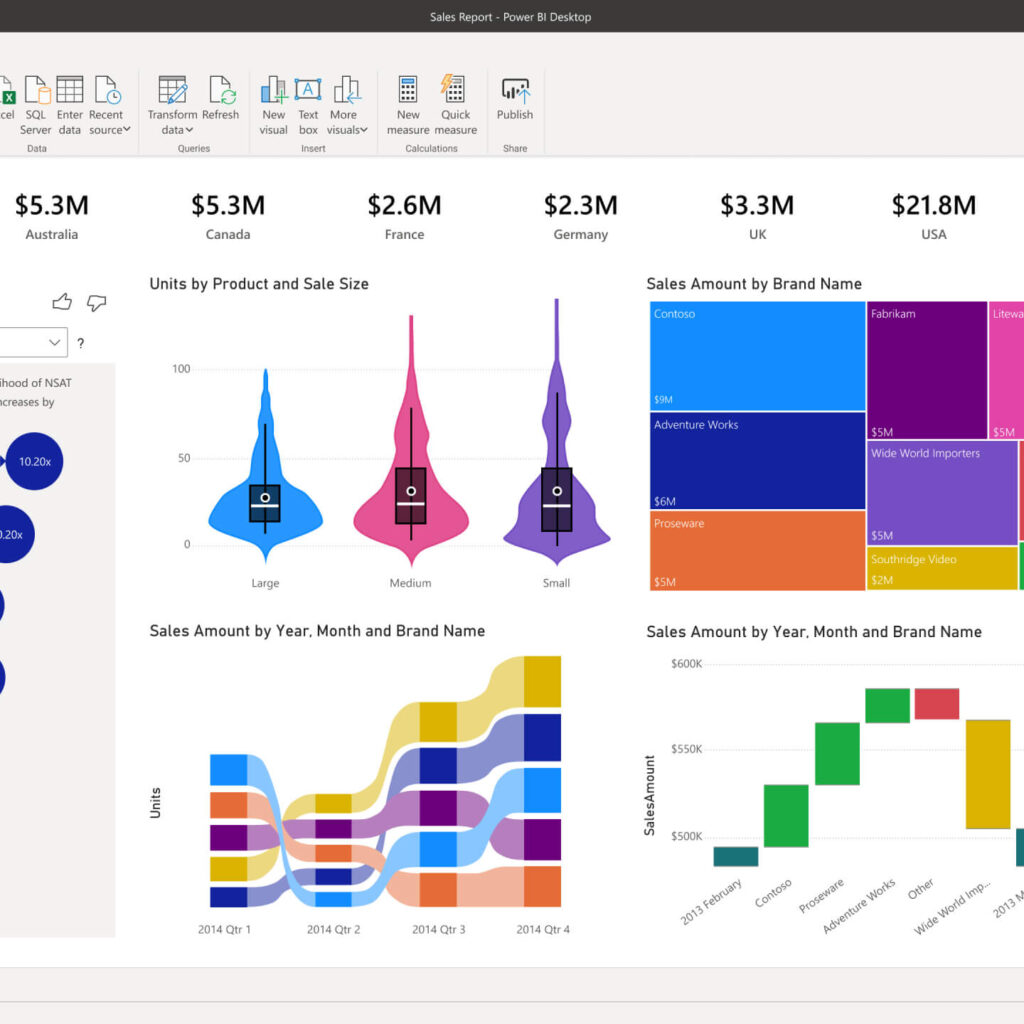
Power BI is a data visualisation tool created by mircosof and allows you to convert data into visuals and collaborate on interactive dashboards and reports. Power BI is used by firms large and small as the pricing is reasonable, some of the larger firms that use it include walmart and L’Oreal. A lot of companies that now use Power BI switched from Tableau or Excel, so is a software to look into if you are looking at expanding in the future and moving away from Excel.
Features
- Create amazing data experiences – easy to connect to, model and visualise your data, create report personalised with your KPIs and brand. Get fast. AI powered answers to business questions.
- Gain insights – make the most of your data by connecting all your data sources. Analyse and share insights across your business while maintaning data accuracy, consistency and security.
- Make decisions with confidence – work together easily on the same data, collaborate on reports and share across Microsoft office applications like Teams and Excel.
- Collaboration & analytics – publish reports to share and collaborate, mobile app access
- Data prep, modelling and visualisation – connect to more than 500 data sources, create reports and visualisation with Power BI desktop, AI Visuals
- Governance and Administration – Data security and encryption, metrics for content creation, consumption and publishing.
Power BI Has three pricing plans starting from $15.10 USD per user/per month for Power BI Pro and Power BI Premium has 2 pricing options either $30.20 USD per user/per month or a per capaity price starting from $7,552.20 USD per month.
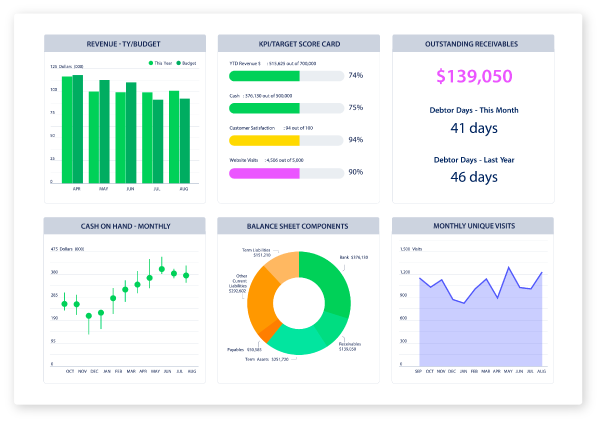
Spotlight reporting is an all-in-one platform for financial reporting, forcasting and KPI tracking. It creates great reports for presenting to investors, the bank or your companies board. It allows business owners or their accountants to easily create great looking performance reports, dashboards, cashflow forecasts and consolidations.
Spotlight Reporting in Xero’s #1 recommended reporting and cashflow forecasting app and is the preferred choice of reporting software used by the Big 4 accounting firms. The app seamlessly integrates with Xero so you are able to import actual and budget data from Xero with the click of a button. Spotlight does also integrate with Quickbooks, MYOB, and excel if you use any of those instead of Xero.
Features
- Comprehensive performance reports
- Full three way forecasting
- Customisable dashboards
- Advanced consolidated reports for multi-entity businesses and franchises and with multi currency
- Industry Templates
- Action plans
- Executive Summaries
- Powerful Integrations – Xero, MYOB, Sage 50 and other non-financial integrations google analytics, and workflow max etc.
- Custom Charts – more than 100 charts with templating and customisation options.
With all the features included in the Spotlight Reporting Suite of tools you will save time creating reports, it can also take the place of several add-ons as it’s not just a dashboard or forcasting app or reporting tool it combines all those tools in one app. The product is always being updated and you can now run tracking category reportung and complete consolidated forecasts with the app.
Pricing starts from $65 NZD per month for 1 Business organisation and additional businesses can be added for another $50 NZD per month. They have pricing options for up to 10 business at $295 NZD per month with additional businesses at $25 NZD per month. As the pricing isn’t the most expensive we have seen it is used within a lot of businesses large and small including accounting firms and The Cheesecake Shop.
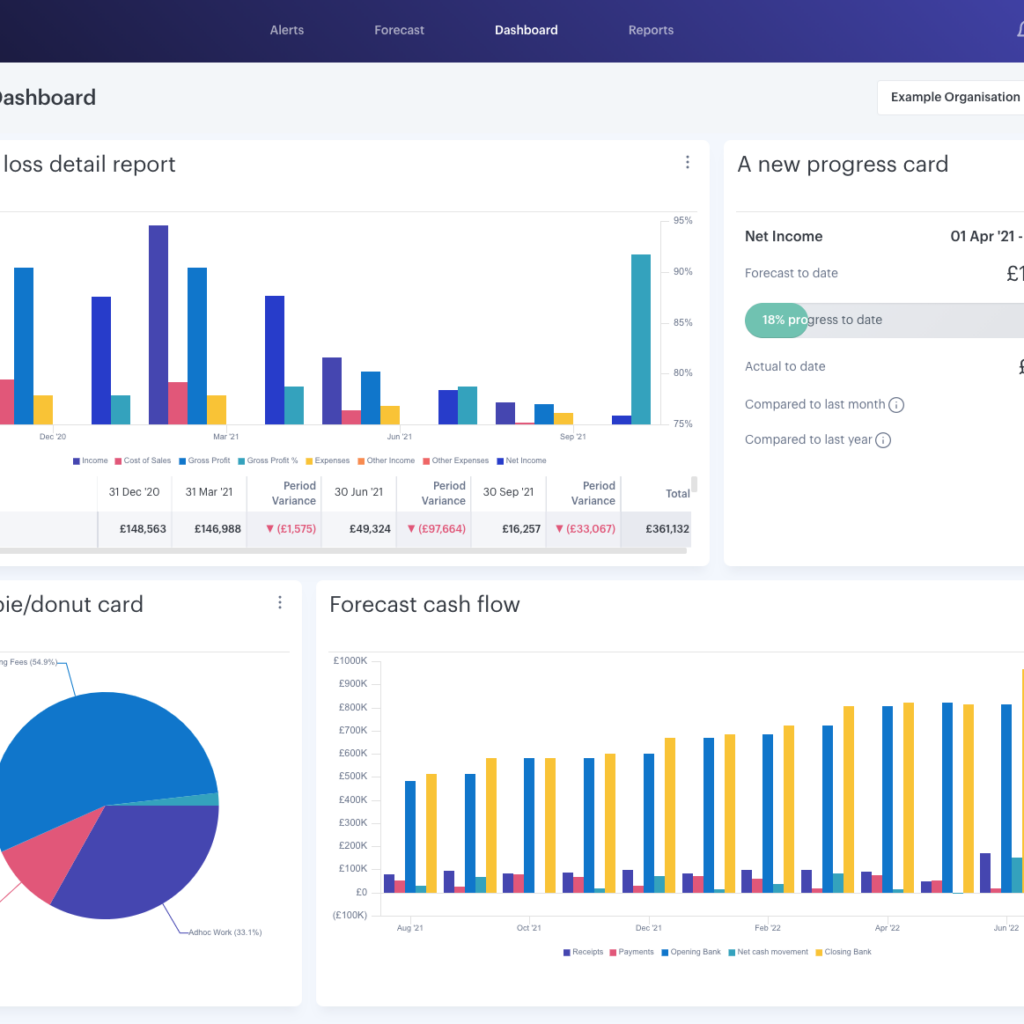
Futrli is a cloud-based forecasting and reporting app that was created for use by Small, medium and large sized businesses. It integrates with the following accounting softwares -MYOB, Quickbooks Online and Xero. Forecasting is the heart of the app, with the capability to project up to 10 years in the future.
Features
- Performance Insights – sales, expenses, profit & cash flow insights. Actual performance to budgets and forecasts. Customer & supplier detailed insights and risks.
- Reporting and Dashboards – drag and drop canvas with templates, pivot-table style easy builder. 1,000s of report and dashboard options. Complete control over styling and branding, share and save reports as templates.
- Instant Smart Budgets – daily figures rolled up weekly or monthly. Predictions are clearly explained by clicking on any cell. Profit & loss, balance sheet and cash flow budget, Due invoices and bills factored into cash flow predictions. Save your budget after refining Futrli’s and your own predictions.
- 3-Way Forecasting – Profit & loss, balance sheet, cash floe and sales tax calculated. Auto, manual and formula predictions. Save as many scenarios as your business needs. Refernce every forecast within reporting and dashboards. Export in one click for funding applications and investors.
- HR Forecasting – Current and future hires can be mapped, one of costs can be added for staff members, UK, ANZ and NZ payroll and taxes supported. Future tax thresholds and pay rises can be incorporated.
Pricing starts from $35+VAT USD per month per business however if you pay the subscription annually you will save 20%. This is quite cheap for a budgeting, forecasting, reporting and dashboarding app especially when you add on the HR, loan and stock forecasting extras that are also included for the price.

Zoho Analytics is a self-service BI and data analytics software that lets you analyse your data and create great data visualisations which will help you uncover insights in minutes.
Features
- Connect – connect to multiple sources including files and feeds, business apps, cloud and desktop software, custom apps and more using Zoho’s connectors. 500+ integration available to connect.
- Prepare – use Zoho’s augmented, self-service data preparation and management module to cleanse, transform, enrich and catalog the data you want to analyse.
- Analyze – Hold conversations with Zoho’s smart AI assistant, generate automated insights with a single click, predict future trends, complete cognitive and what-if analysis, setup smart alerts and much more.
- Visualize – build insightful & interactive reports and dashboards with Zoho’s drag and drop interface. Use the large range of charts, widgets, pivot tables and tabular view components to visualise your data.
- Collaborate – collaborate eith other users through secure sharing and permisiions.
- Build – use the low-code, no-code model to easily build and embed analytics.
Zoho Analytics has 4 pricing options starting from $42+GST AUD per month for 2 users and increasing to the largest option of $810+GST AUD per month for up to 50 Users. Each option has different features do check out their feature comparison to ensure you choose the right plan.
Most people will already have Excel on their computers or have a